

Sustaining our cities through sound fiscal stewardship
An introduction to methods and approaches Verdunity has created for cities to better steward their financial resources.
⇩
Does your community have enough money to pay for the basic services and infrastructure maintenance required to continue current service levels?
*Cities of different types; all have resource challenges; all need to understand their resource gap*
As humans, we build cities to elevate the quality of life for people. We all benefit from coming together for that common goal. Cities have a great opportunity to take huge strides toward building a city generations of people want to live in and visit. We have population and economic growth projected for some time into the future. Our biggest obstacle to creating a network of cities built to last boils down to our ability to steward our resources well. At Verdunity we focus on creating unique and innovative ways to better manage our financial resources with transparency, and a clear vision of the future. We strive to unpack the city building process, how it impacts the fiscal future of the city, and what a city can do to impact that future.
The right analysis requires the right data.
A fair number of cities will use appraised or assessed value data to do some form of fiscal analysis. It's available and paints a picture of how development impacts the fiscal sustainability of the city. However, while appraised or assessed value tells a particular story about the fiscal impact of development patterns; it does not tell the most useful story for cities.
Appraised value // Dallas County →
When we partner with a city to run our fiscal analysis we use property tax revenue data. This data excludes tax exempt properties, reflects the impact of the city's tax rate, and accounts for various property tax caps and exemptions. This more accurately reflects the true fiscal contribution or different development patterns. We also focus our attention on revenue per acre rather than the total value per lot. This tells a much more useful story for long range financial planning. It's also a dramatically different story than we get from total appraised value per lot.
← Revenue per acre // Dallas County

For example, we've recently worked with a variety of cities across Texas. In every city we've worked we find an inverse relationship between the revenue per acre and the average improvement value per lot for both single family residential and commercial properties. In the charts below, we see the analysis across a variety of cities including the City of Bastrop, Brownsville, Crowley, Pilot Point, and Pflugerville, Texas.

We've heard many conversations from city officials, staff members, and private developers trying to identify the average home value that generates enough revenue so that development pays for itself. It’s a misguided effort and completely the wrong metric to look at for cities. Its an appropriate metric for developers, based on how they generate revenue to recoup costs. However, a city generates costs and revenues differently than a private developer. Many cities across Texas are trying to get bigger lots with homes in the highest price range possible. It’s a potentially dangerous effort considering the negative relationship between revenue per acre and lot size evident in these charts.

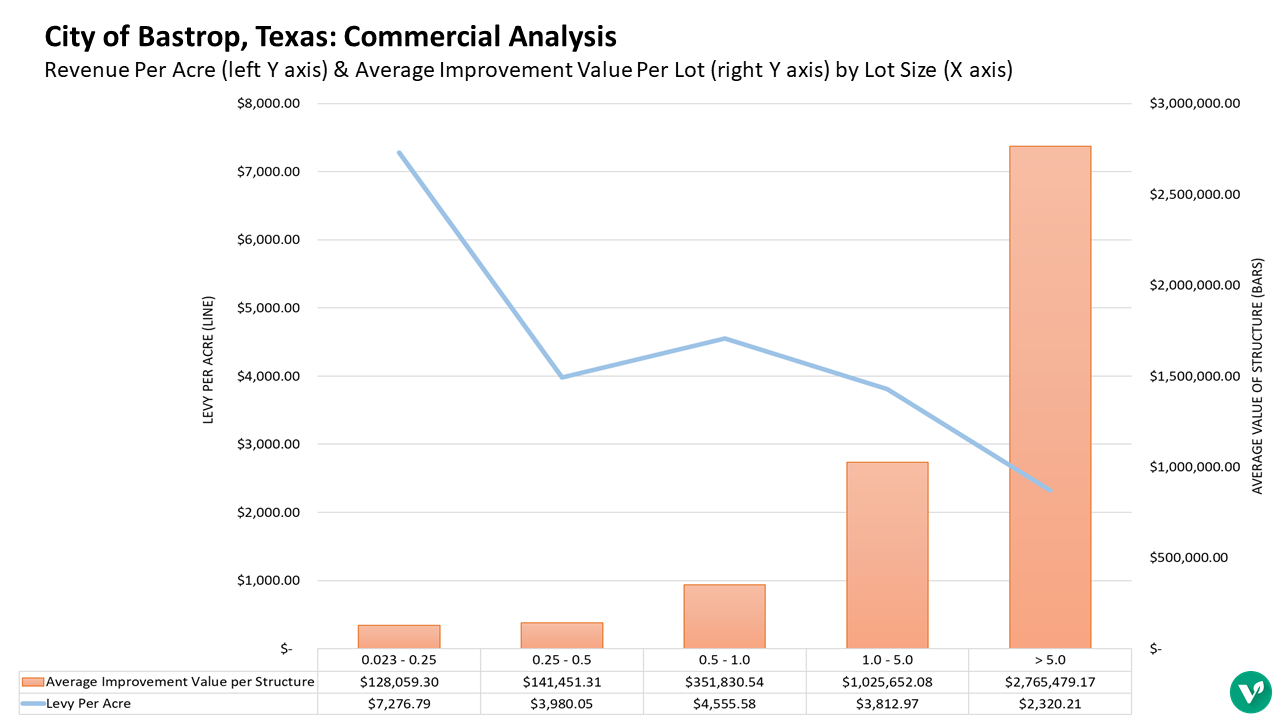


Contrasting revenue per acre with average structural value:

Commercial Properties:
Here is an example of how our charts could better fit into a website, graphically. There is still an issue with the scale of the chart (the millions on the right and the thousands on the left are off kilter, for example). These take time to pretty-up, but if you want to make it pop and look professional, I recommend giving this treatment to our graphs.
-jordan
Some examples from our work…
⇩

Bastrop, Texas
(Describe the significance of this project)


Scenario A.
Once we have the revenue data mapped out we'll then add costs data. Most of our projects begin by creating scenarios A, B, and C (see maps above). Scenario A requires that we allocated the property tax revenue back out to the parcels as costs. We do that using a proportionate area methodology that we customize for each city.
After we allocate costs we arrive at scenario A, which we can see in this map created for a project in the City of Bastrop, Texas. We typically illustrate the scenarios using net per acre or return on investment. The net per acre (NPA) illustrates the net gain or loss divided by the acreage. The return on investment (ROI) metric illustrates the amount of revenue generated for every dollar of cost. So if a parcel has a cost of $100 dollars and generates $50 in revenue then it operates with an ROI of -$0.50. That means for every dollar spent on that lot the city is only getting $0.50 back; that's a 0.50 loss on every dollar spent.
Scenario A for Bastrop illustrates which parts of town have the highest ROI in dark green, and which have the lowest ROI in dark red. We can easily see the historic downtown in the center of town with lots of dark green. We can also see the other development patterns around town in various shades of green, pink, and light red. Scenario A can tell us quite a bit, but its only reflecting the currently budgeted revenue. It does not account for any unfunded service or facility needs.
Scenario B.
Scenario B involves allocating unfunded maintenance and infrastructure needs. For this project we added all unfunded street maintenance needs on top of the existing costs allocated in scenario A. The additional costs included in scenario B create a more realistic visual of the true costs a city needs to account for. In this case you can see that even with a $7.2 M annual funding gap some development patterns operate at a gain even with the additional costs. Those are the development patterns we encourage cities to focus on if they want their future development to help close the funding gap.
Scenario C.
Our next step involves projecting what kind of impact future development might have on the fiscal outlook of the city. In this case, we projected the existing future land use plan the City of Bastrop had at the time of this project. We can see in this map that the future development reduces the overall gap from $7.2 M annually to $4.5 M annually. At this point the discussion shifts to how the city wants to close the remaining gap. We have a wide range of approaches which we discuss with each city we work with.

Pflugerville, Texas
(Describe the significance of this project)


Scenario A
Below is another example from work we've done in the City of Pflugerville, Texas. In this case we have scenarios A and B mapped along with a number of data tables. Scenario A shows the more developed western portion of Pflugerville providing most of the property tax resources.
Scenario B
Then, we see a dramatic shift going from Scenario A to Scenario B by adding the additional unfunded street maintenance costs. Maps tell a powerful story, but they don't paint a complete picture all by themselves. Earlier you saw some examples of some charts we typically provide.

heading?
We also use the data to build some enlightening tables. This first table describes how development categorized by the state land use code performs. Appraisal districts assign properties with the use code for taxing purposes, so these categories more closely reflect what's been built than zoning or land use districts will. In this table we break down single family, multifamily, and commercial uses into lot size segments to reveal patterns in how lot size impacts fiscal performance.
Take notice of how these numbers reflect the trends illustrated in the charts shown previously. As the lot size increases the average improvement value (Average Imp Value) also increases, but the revenue per acre (Rev / Acre) decreases. You can also see how the different development patterns perform across scenarios A & B.
We also run the same data queries for the zoning districts, land use plan districts, or both for a city we partner with. In this table you see how the City of Pflugerville's zoning districts perform when developed. We can use these trends to project how undeveloped land with the same zoning might perform fiscally.

Or, if the development pattern a city would like to project does not currently exist within the city, we can take context data from others cities that have developed in the desired pattern. Below are three examples of context data used in a recent comprehensive planning project.


Pilot Point, Texas
(Describe the significance of this project)


Scenario A
We can also use proposed development projects for projecting a scenario C Map. We recently worked in Pilot Point, Texas. Above, you can see Pilot Point's scenario A map.
Scenario B
Pilot Point's scenario B map shows the same heavy fiscal impact as previous maps when the budget includes unfunded street maintenance.
Scenario C: High
For Pilot Point, we looked specifically at proposed planned developments recently approved or up for consideration. A planned development is a zoning district created for a specific development site in a partnership between the city and the developer. Typically, a planned development zoning happens when a proposed development project meets the intent of the zoning ordinance and the comprehensive plan, but deviates enough in technicalities so that its not allowed.
We used the proposed infrastructure improvements to calculate long term costs. Then we combined context data with the projected price ranges for the different developments to create a potential low and high revenue scenario C. Here you see the scenario C with the high end revenue projections and how it impacts the deficit, dropping it from $2.61 M to $1.48 M annually.
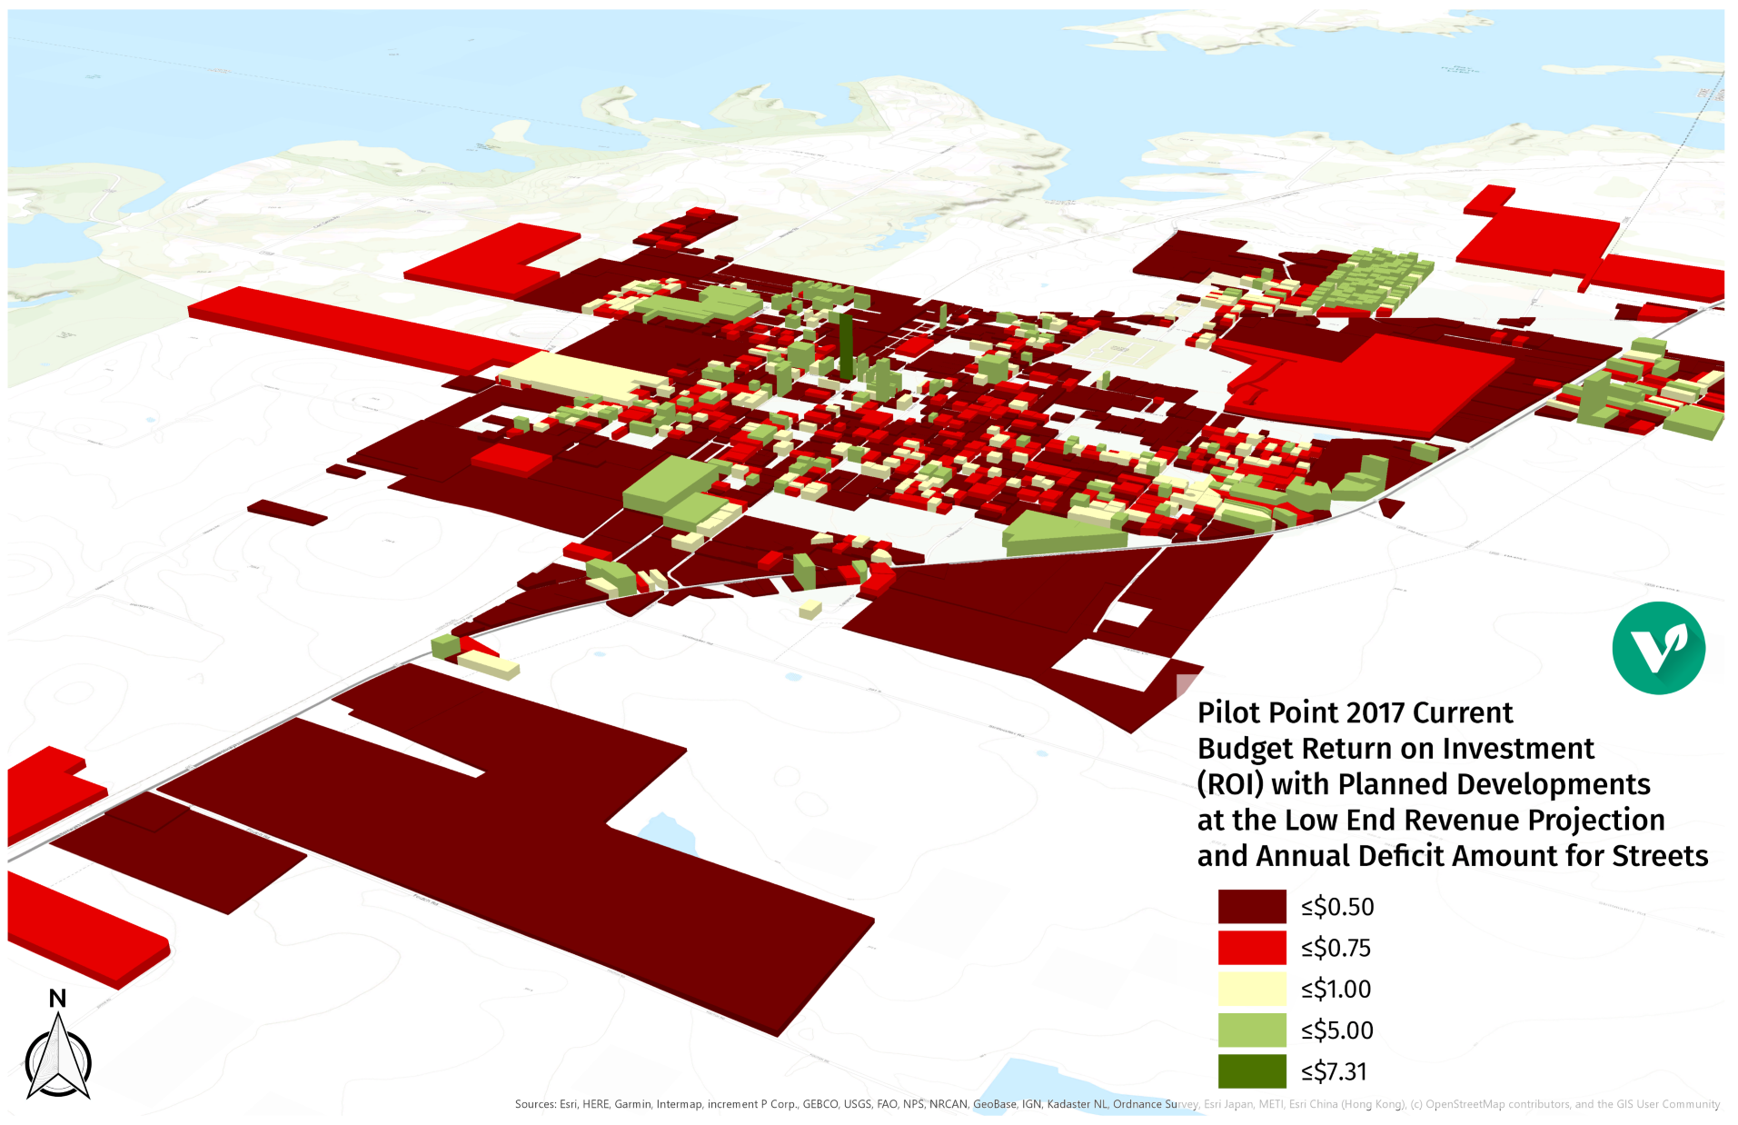
Scenario C: Low
Then, we can see the impact of the same developments under a lower assumed revenue performance. In this case the impact of the new developments remain positive overall, but provide much less progress in closing the gap, only decreasing the annual deficit from $2.61 M annually to $2.06 M annually.